Whats Happening: Bleaching at Moore Reef 2020
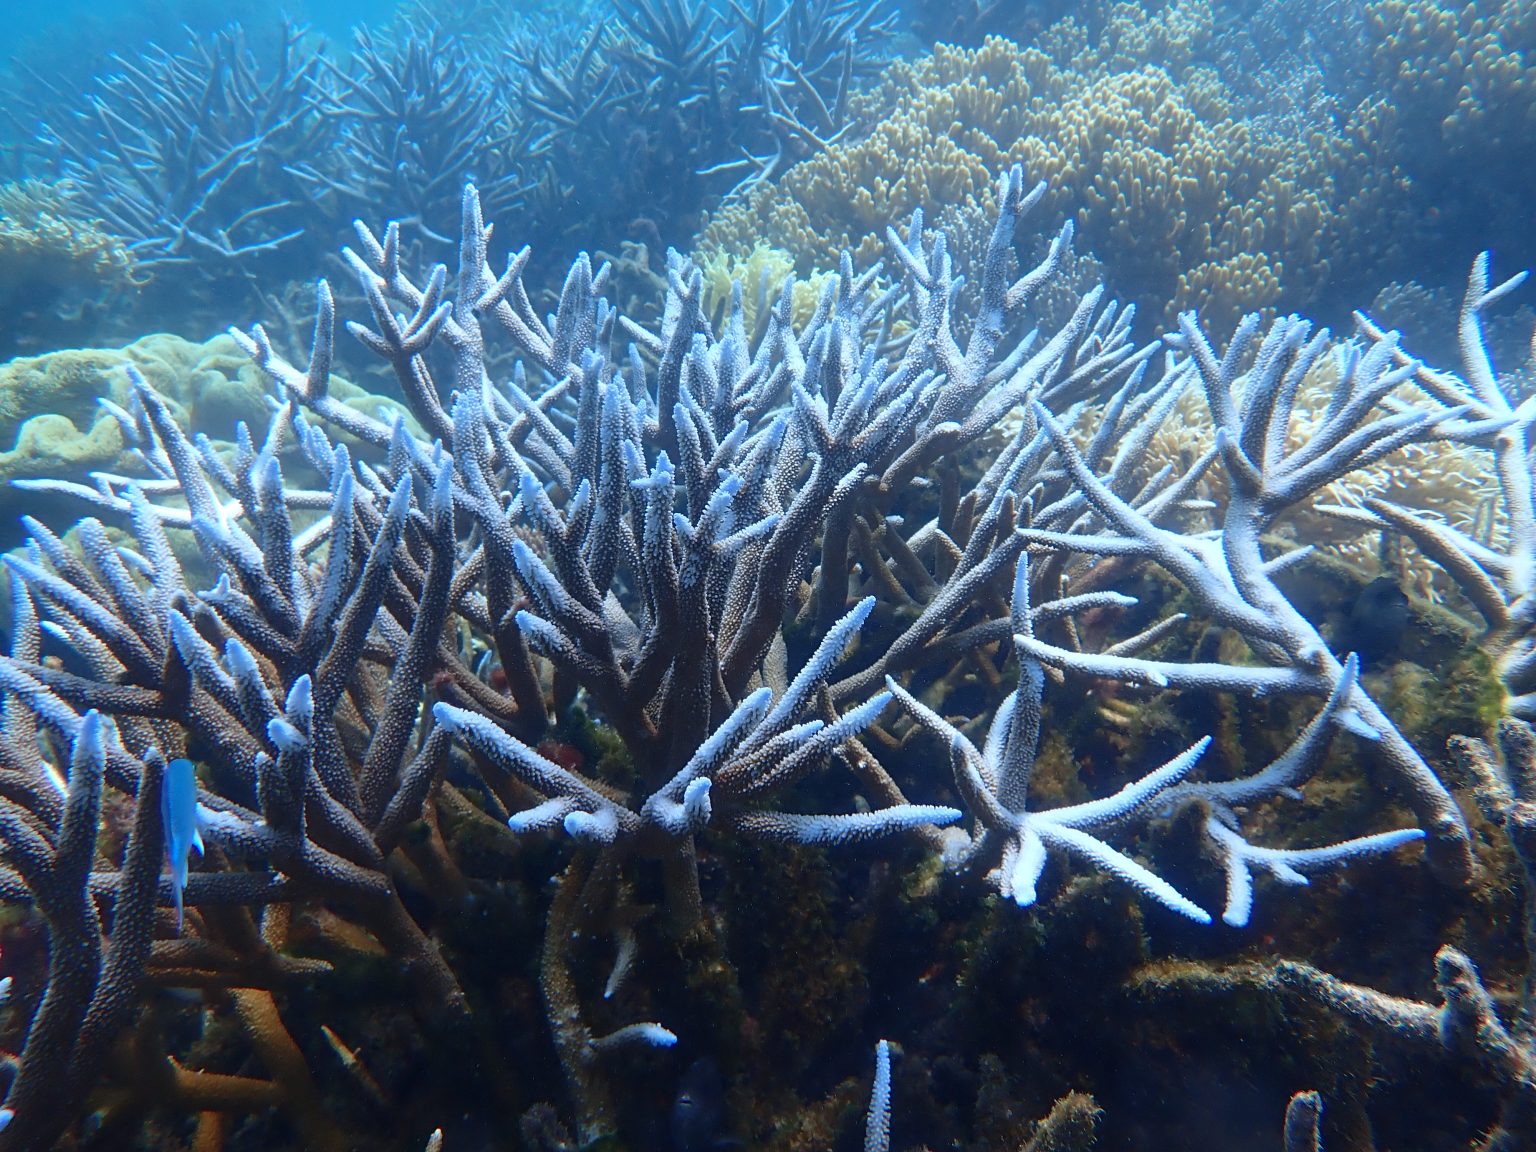
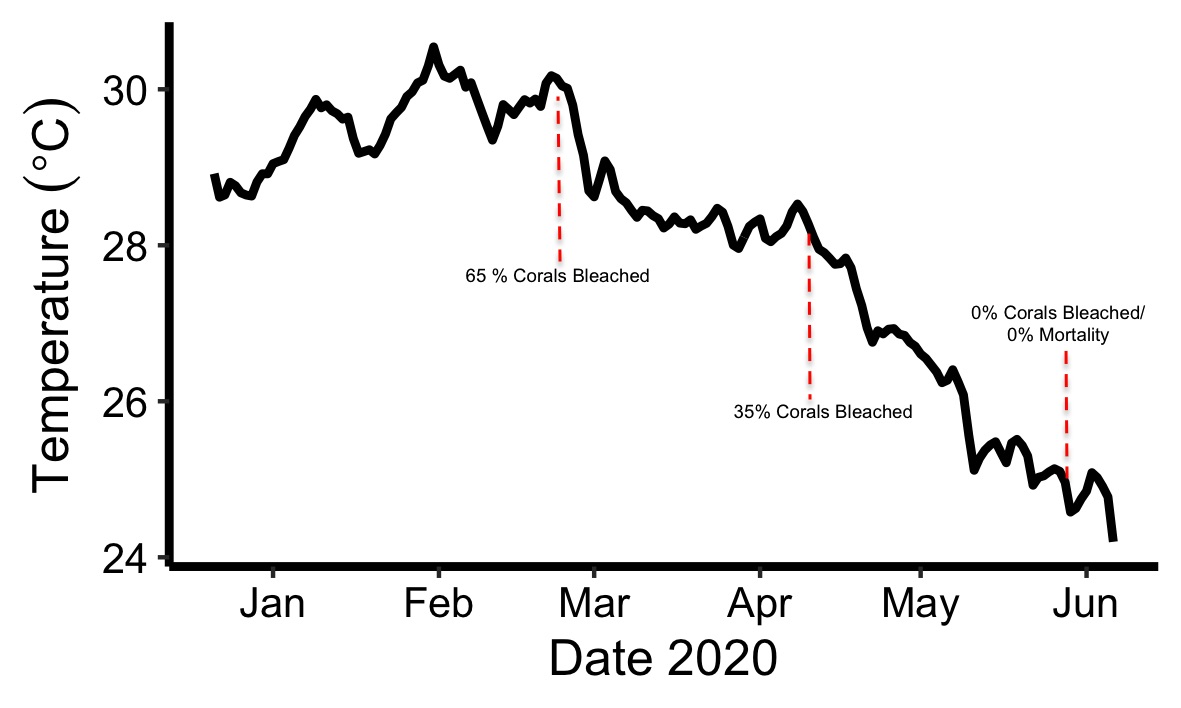
Daily average water temperature graph from Reef Magic Pontoon site. The logger was positioned in the middle of coral lagoon at 3 meters’ depth and recorded an observation every 5 minutes between late December 2019 till early June 2020. This section of Moore Reef Experienced 1 to 2°C above average temperature from early February till mid-April. This placed coral in the lagoon section of Moore reef under stress, with 65% corals showing visible signs of bleaching and subsided to 35% by mid-April (see coral photo). Corals were surveyed using the Eye on the Reef, Reef Health Impact surveys. The majority of corals were only experiencing mild signs of visible thermal stress and by late May all corals had recovered and no mortality was recorded.